       The Last 100 Years
       The Last 1500 Years
The long series of observations for the CCS show that major qualitative
changes in both physical and biological characteristics have occurred
over the past 60 to 70 years. Abrupt changes in the physical background
and ecosystem structure were first clearly recognized in 1958 with the
occurrence of widespread "anomalous" conditions which could be
quantified and compared to the previous ten years of CalCOFI survey data
and with temperature and pressure data stretching back to the early
decades of the twentieth century (Reid, 1960). These changes are now
well understood as a regional manifestation of the Pacific-wide
variability associated with the El Nino-Southern Oscillation phenomenon.
The physical response of the CCS to the interannual climate variability
of ocean-atmosphere coupling of ENSO has now been documented (e.g., from
CalCOFI data).We have been much slower to recognize the nature and significance of changes in EBCs which occur over longer time scales. This is not surprising since our understanding of a dynamical system is constrained by the dimensions of space and time encompassed by our observations. Instrumentation and fisheries time series records are not sufficiently long to permit a comprehensive description of the variability in the physical environment and the biological response at longer scales, at which very large and fundamental changes occur.
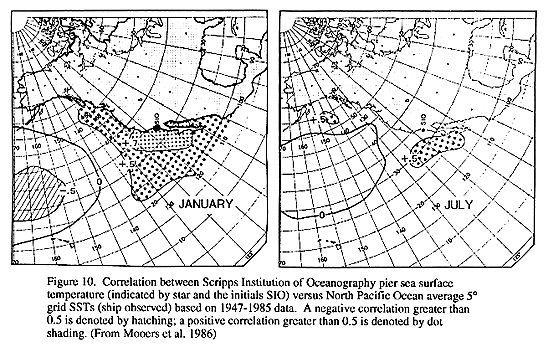
The spatial coherence of correlations of winter temperature anomolies in the CCS to Scripps Pier SST (Fig. 10, Mooers et al. 1986) indicates that Scripps Pier SST is a useful proxy for temperature fluctuations over a large area of the CCS. The Scripps Pier temperature series shows three distinct periods: 1) a period (ending around 1945) of relatively warm temperatures; 2) a period (from 1945-1976) of generally cooler temperature, interrupted briefly by the warm temperatures of the 1957-1958 El Nino; and, 3) a warm period from 1977 to present. Transitions between these periods were abrupt, occurring within 1-2 years.
Although the Scripps (SIO) Pier SST time series reflects the general patterns of SST along the west coast, an examination of available multi-decadal time series (of many parameters, not just SST) along the west coast of North and South America shows that superimposed on the generally coherent patterns and trends of the basin-scale indices are substantial regional differences in wind forcing (Mendelssohn 1994), sea level (Schwing 1994b), SST and salinity (Schwing 1994a,b). Regional variability includes differences in the long-term rate of change, response to interannual differences (e.g. ENSO events), and changes in seasonal patterns. Figure 10 illustrates the decorrelation between SIO SST and U.S. west coast SST during summer. Within regions, whose spatial extent approximates the four regions defined earlier, these signals appear to be more coherent, suggesting that fundamental differences in the atmospheric and oceanic processes that dominate in each region may impact the environmental response to climate change on those space scales.
Plotted above the time series of Scripps Pier SST in Figure 9 is the equatorward component of the mean geostrophic wind during spring (April-June) at 30 deg N between 110 deg and 130 deg W (from Ware and Thomson (1991) and estimates of sardine and anchovy biomasses for the central region of the CCS. Wind speed and ocean temperature show a striking inverse relationship during the period when the time series overlap (1917-1960). Periods of cooler temperatures in the 1950s and 1960s are associated with higher wind speeds. Elevated temperatures from 1925 through 1945 occurred in a period of diminished northerly winds.
The time series of sardine and anchovy biomass estimates for the central region of the California Current (Figure 9, upper plot) indicates an intriguing coincidence between a major shift in species dominance in the schooling pelagic fish of the ecosystem and the transition from a period of lighter wind conditions and warmer SSTs to cooler SSTs with stronger northerly winds. The recovery of the sardine population (and decline of the anchovy population)beginning in the late 1970s or early 1980s (data not shown) also suggests a link to the ocean environment which is forced by regional climate change. Although the decline of the sardine population after the 1940s has long been thought to be a result of intensive fishing, some fisheries scientists are now suggesting that fishing may have exacerbated what would have been a natural and much less serious shrinking of the population. The heavy fishing mortality resulted in the near-complete collapse of the population, and may also be responsible for the sluggish recovery after 1977 (Jacobsen and MacCall, in press).
Physical and biological measurements from the CCS and the central North Pacific indicate that the interdecadal variability appears to be part of basin-wide processes of ocean-atmosphere coupling. Associated with the shift to warmer temperatures in 1977 and the subsequent sputtering recovery of the Pacific sardine in the CCS, is a notable decrease in zooplankton biomass in Region III of the CCS (Roemmich and McGowan, 1994). Concurrently, the ocean interior of the central North Pacific has cooled and a significant increase in deep phytoplankton biomass has been measured there between 1968 and 1985 (Venrick et al. 1987). At slightly longer time scales, MacCall and Praeger (1988) suggest that the large changes in fish populations sampled by CalCOFI ichthyoplankton surveys since 1951 reflect an ecological response to a shift between distinct physical regimes.
These multi-decadal changes in physical and biological conditions of the CCS may represent abrupt shifts between climate states or "regimes" in the ocean/atmosphere system (e.g. Trenberth, 1990). It is now believed that the ocean-atmosphere circulation changed dramatically after 1976 (Trenberth, 1990; Graham, 1994; Miller et al., 1994a, 1994b; Trenberth and Hurrel, 1994). This occurred by an eastward shift in the position of the Aleutian Low pressure system and intensification of the atmospheric low leading to (1) cooler SSTs in the interior North Pacific and (2) warming along the coast. Between 1945 and 1976 the Aleutian Low pressure system was further westward and weak compared to more recent times (Trenberth and Hurrel, 1994).
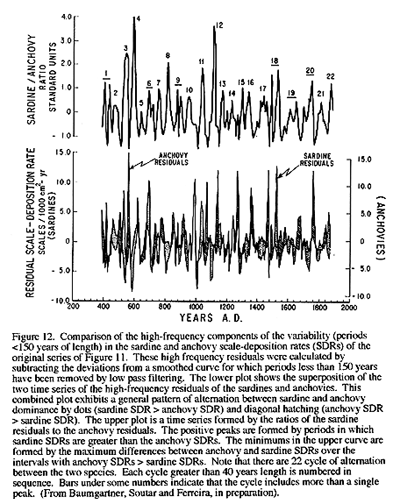
Spectral analyses of the sardine and anchovy population abundance estimates of Figure 11 indicate strong peaks at ca 60 year periods. During the ca. 1500 year long record there were 22 cycles of alternation in species (sardine vs. anchovy) dominance (Fig. 12). Average length of these cycles is ca. 65 years--similar to the length (55 years) of one ocean-atmosphere cycle observed in SST this century (from ca. 1922-1977; Fig. 9). The relationship between the two small pelagic species is consistent with the observation (Fig. 9) that sardines dominate during warm coastal ocean phases and diminished northerly winds while anchovies dominate during the opposite ocean-atmospheric phase (regime). Similar alternating dominance of sardines and anchovies (or anchovetas) have been observed in other boundary current systems during the twentieth century (Daan, 1980; Lluch-Belda et al. 1989).
From these observations it is reasonable to formulate a hypothesis that interdecadal fluctuations in ocean climate over the North Pacific of the kind modeled by Miller et al. (1994b) create changes in habitat which tend to alternately favor sardines or anchovies for intervals of roughly 30 years. The sardine-anchovy relationship in Figure 12 would thus imply that the process of reorganization of the ocean-atmosphere coupling has gone on for at least the past 1500 years with a characteristic period averaging around 65 years in length.