We have just completed a study of processes controlling the recruitment of the marine calanoid copepod, Temora longicornis, in Long Island Sound (Peterson and Kimmerer, in press). In that paper we discuss factors controlling egg production, egg mortality and cohort survival rates. One of the remarkable results we wish to highlight in this article is that we found egg mortality rates to be extraordinarily high--no more than 10% of the eggs produced on any given day reached the first nauplius stage. Here we outline our method for calculating egg mortality rates, present some of the results of the analysis of our Temora longicornis data, and include results of analyses of some new data sets.
To estimate egg mortality rates, one needs four pieces of information:
     Parameter    		  Symbol		        Units
egg production rate	               B		eggs female-1day-1
female abundance	              Nf		     females L-1
egg abundance in situ 	               E		     eggs L-1
egg development time 	               D		     days
At steady state, the rate at which eggs (or any other developmental stage) pass through that stage is a function of the rate at which they enter the stage and the mortality rate, m, within the stage (Kimmerer, 1987). For eggs,
Ra = Ro e-ma (1)
where Ra is the rate at which eggs pass through age a, Ro is the rate of egg production per unit volume, and m is the daily mortality rate. This can be integrated over a from 0 to D to obtain the number of eggs per unit volume,
E = Ro [(1 - e-mD) / m)] (2)
substituting for Ro = (B) (Nf) and rearranging yields
E/BNf = (1 - e-mD) / m (3)
Mortality rate is determined iteratively from (3). The proportion of eggs surviving for one day is calculated from
S = e-m (4)

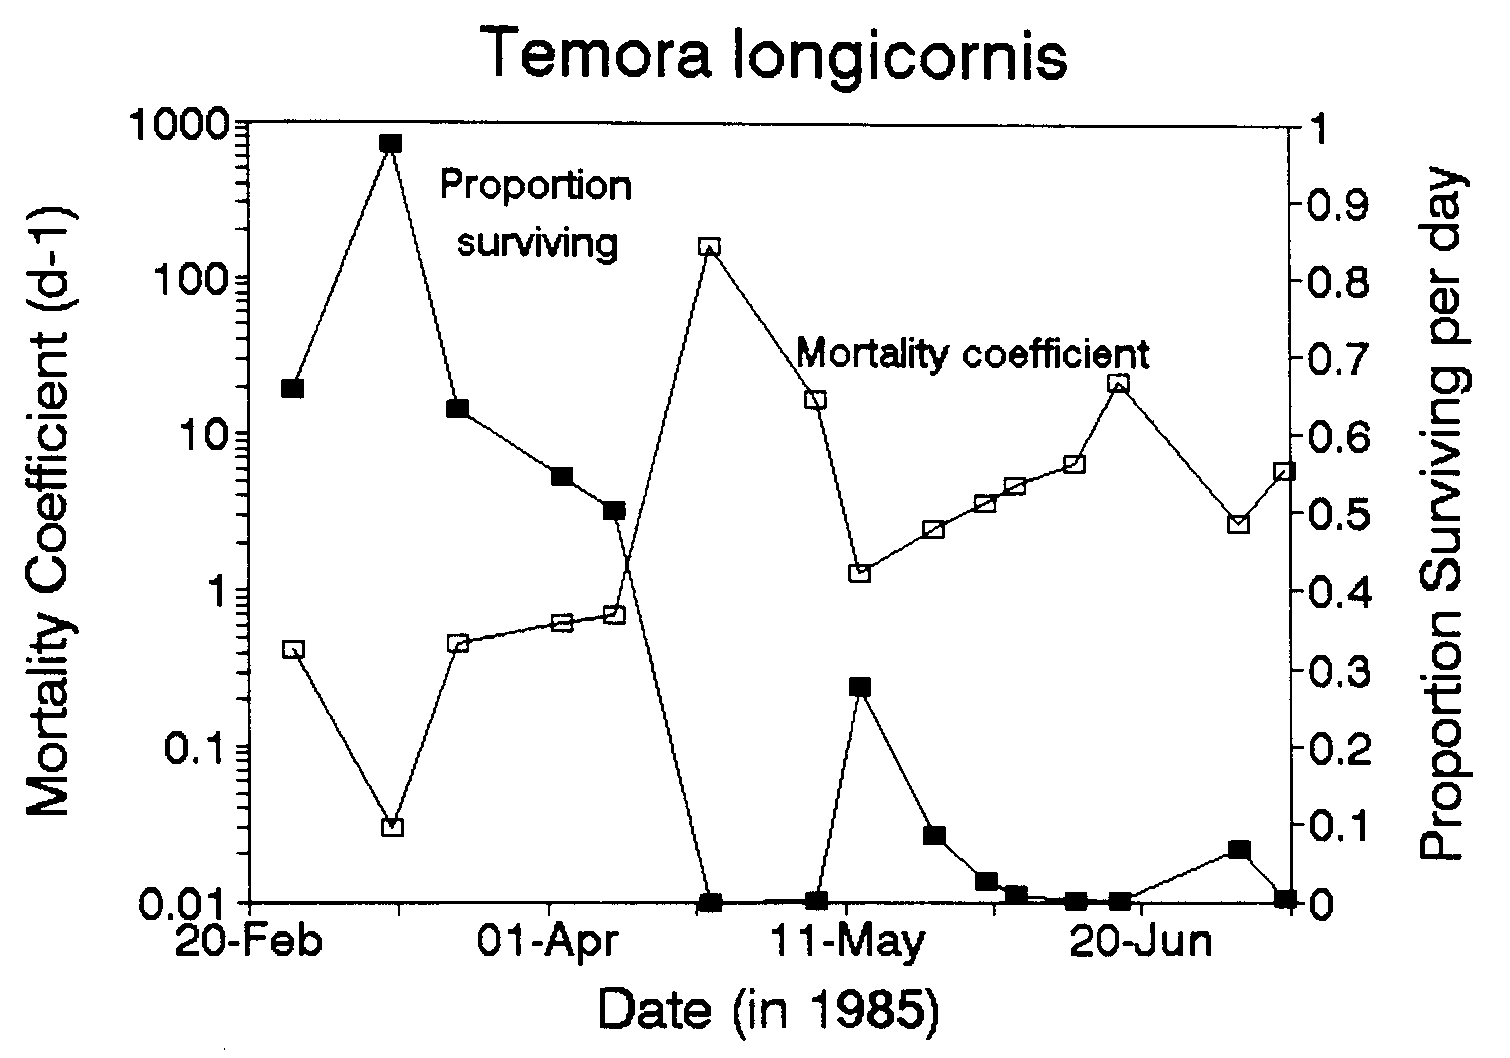
Figure 1 shows the time series of mortality rate and proportion of eggs that survive each day. The median mortality rate for the first half of the study period (18 Feb-10 Apr) was 0.46 d-1 and for the second half of the study period (23 Apr-9 July) was 5.3 d-1. The median percentages of eggs dying per day for the same two periods were 37% d-1 and 99% d-1.
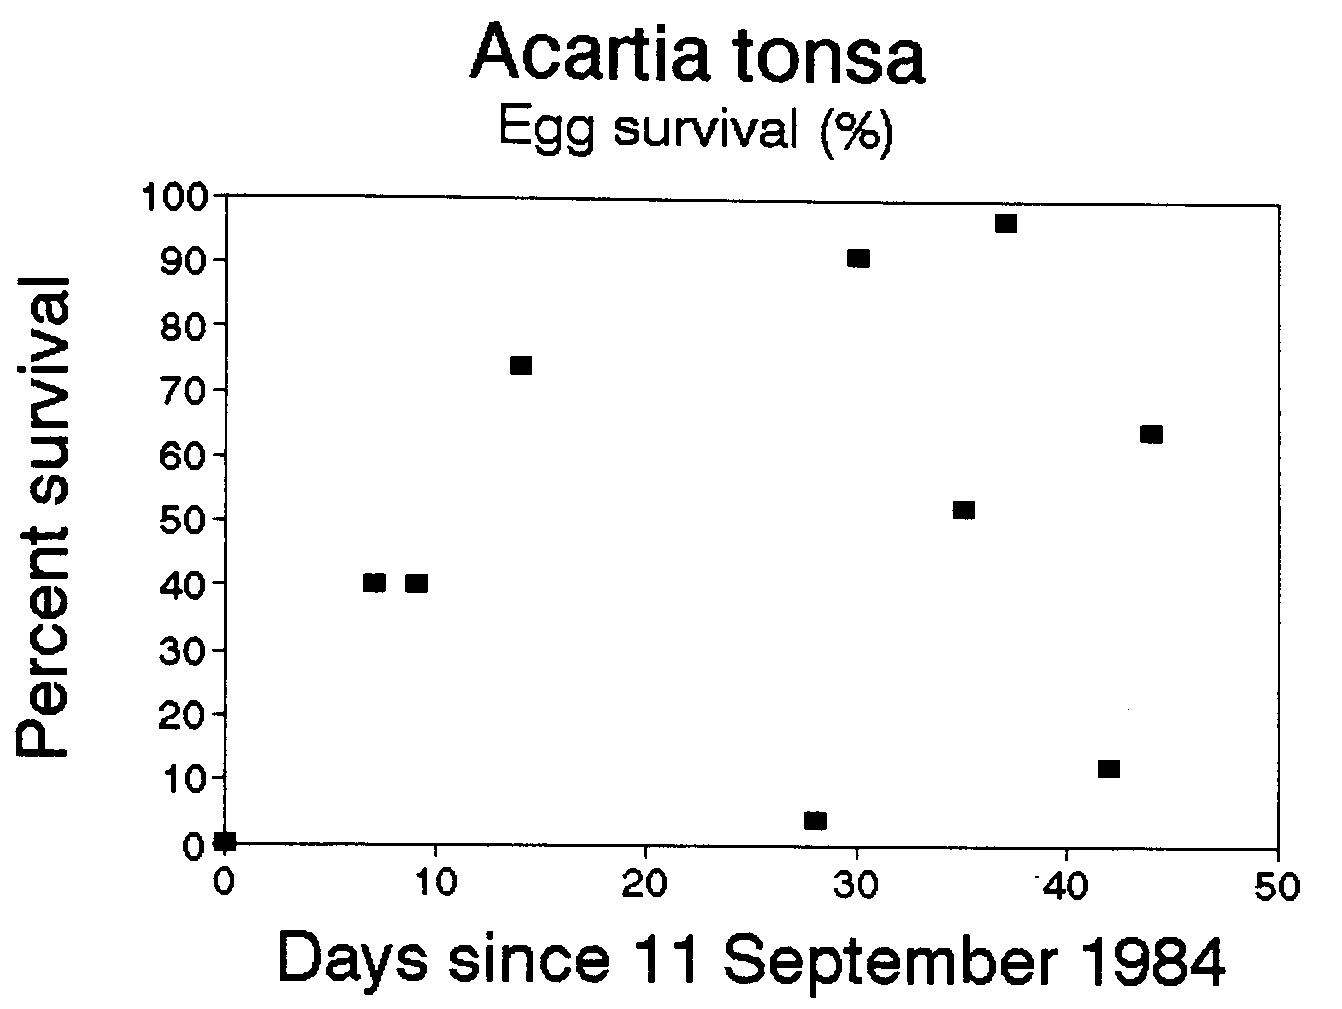
We are aware of three other data sets that could be used to calculate egg mortality rates: two of these data sets are published--Beckman and Peterson (1986) study of Acartia tonsa in Long Island Sound, and Van Rijswijk et al. (1989) study of Temora longicornis in the Netherlands, and one unpublished data set on Calanus chilensis off Chile, some of which were presented in Peterson et al. (1988). For Acartia tonsa we found somewhat lower mortalities than in the Temora longicornis example above: mortality coefficients averaged -1.4 d-1 and survival, 48% d-1 (Figure 2). However for both the Van Rijswijk et al. (1986), and Peterson et al. (1988) data sets, we found positive mortality for most sampling dates. This means that there was either a surfeit of eggs or a deficit of females, a situation which could arise by advection of eggs into (or females away from) the sampling site. In both of these cases, the stations sampled were highly influenced by advection. The former was in a tidal creek in the Netherlands and the latter in the coastal upwelling zone near Talcahuano, Chile. Thus, the method we describe may only work in regions that are not highly advective, such as in Long Island Sound, fjords, and perhaps on submarine banks--such as Georges Bank or Agulhas Bank off South Africa--characterized by retention zones, or within a recirculating eddy.

A final note: it should be clear that one should not use the egg ratio method to estimate egg production rates in situ because the calculation is based on abundances of eggs and females in situ. Because of the possibility that eggs do not survive to hatch, the egg ratio method underestimates the true egg production rate by some unknown amount. Thus, the egg production data of Checkley (1980) and Peterson (1985), for example, should be interpreted with caution. (Bill Peterson is a biological oceanographer and currently program manager of U.S. GLOBEC. Wim Kimmerer is a marine ecologist with Biosystems Analysis, Inc in Tiburon, California)
Checkley, D. M. 1980. Food limitation of egg production by a marine, planktonic copepod in the sea off southern California. Limnol. Oceanogr., 25, 991-998.
Kimmerer, W. J. 1987. The theory of secondary production calculations for continuously reproducing populations. Limnol. Oceanogr., 32, 1-13.
Peterson, W. T. 1985. Abundance, age structure and in situ egg production rates of the copepod Temora longicornis in Long Island Sound. Bull. Mar. Sci., 37, 726-738.
Peterson, W. T. and 6 others. 1988. The nearshore zone during coastal upwelling: daily variability and coupling between primary and secondary production off central Chile. Prog. Oceanogr., 20, 1-40.
Peterson, W. T. and W. J. Kimmerer. In press. Processes controlling recruitment of the marine calanoid copepod Temora longicornis in Long Island Sound: egg production, egg mortality and cohort survival rates. Limnol. Oceanogr.
Van Rijswijk, P., C. Bakker, and M. Vink. 1989. Daily fecundity of Temora longicornis (Copepoda, Calanoida) in the Oostershelde estuary (SW Netherlands). Neth. J. Sea Res., 23, 293-303.