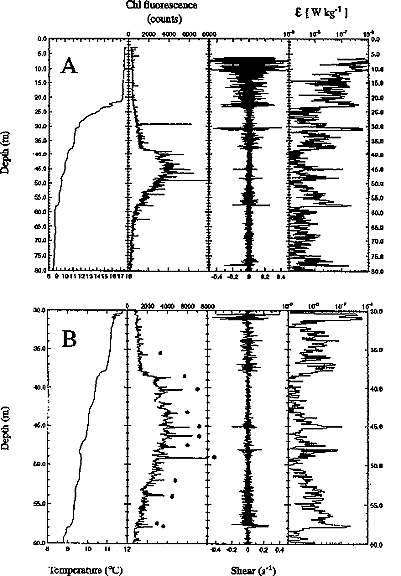
Figure 1. A) Vertical profile (0-80m) of temperature, chlorophyll
fluorescence, horizontal velocity shear, and 10 cm estimates of turbulent kinetic
energy dissipation during an interval of low wind stress (<3 m s-1). B) An expanded
view of the 30-60 m segment of this vertical profile, with thin layers identified with
circles.

