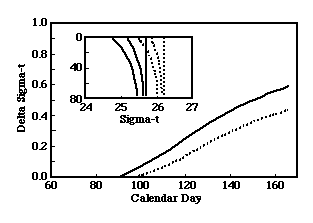
Figure 2. Results of a model of the seasonal development of
stratification (density difference between the surface and 40 m) on
Georges Bank for winter water temperatures of 8°C (solid line) and 4°C
(dashed line). The inset shows the vertical distribution of density
(sigma-t) in March (rightmost), April, and May (leftmost) for the two
cases.

