 Ted Strub(OSU) and Suzanne Strom(WWU/SPMC) provided the update for the Northeast Pacific. Ted began with a
description of altimeter data observed in the vicinity of the Seward survey line. These data suggest that
temporal and spatial variability in mesoscale circulation could be considered the largest controlling factor in
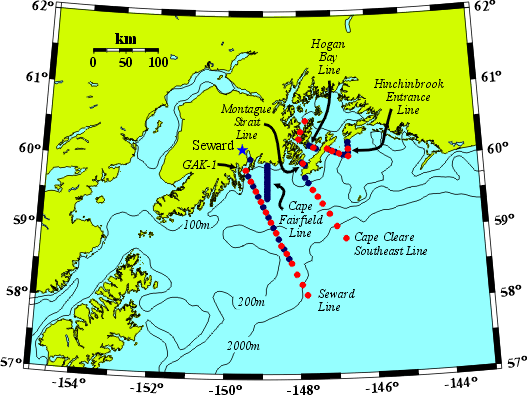
the region. In the Coastal Gulf of Alaska (CGOA) most stations are occupied along the Seward Line. Because of
the mesoscale variability, a second line (the Cape Clear Section) was added parallel to and 'upstream' of the
Seward Line to provide a context for these observations. There is also indication of a degree of predictability
in the temperature field around the Hecate Bank region between years.
Ted Strub(OSU) and Suzanne Strom(WWU/SPMC) provided the update for the Northeast Pacific. Ted began with a
description of altimeter data observed in the vicinity of the Seward survey line. These data suggest that
temporal and spatial variability in mesoscale circulation could be considered the largest controlling factor in
the region. In the Coastal Gulf of Alaska (CGOA) most stations are occupied along the Seward Line. Because of
the mesoscale variability, a second line (the Cape Clear Section) was added parallel to and 'upstream' of the
Seward Line to provide a context for these observations. There is also indication of a degree of predictability
in the temperature field around the Hecate Bank region between years.
In the California Coastal Current (CCC) Adriana Huyer et al. have conducted hydrographic surveys out of New Port (44.6° N) since 1997. This Long Term Observing Program was in place to observe the El Nino/La Nina transition. Mark Ohman suggested examining the Scripps Pier air temperature time series in conjunction with the historical data associated with the Newport survey. The Scripps Pier data display a shift to a warmer state in the mid 1970's and salp abundance measured in CalCOFI monitoring declined during this same time period.
Ted next discussed sardine synchrony across ocean basins and related it to the 200hPa height anomalies suggesting that large scale processes are at work.
Loo Botsford is working in the CGOA and CCC to examine relationships between chinook and coho salmon which are responding to the same environmental changes in different ways. Spawning distributions do not account for observed differences.
Dale Haidvogel briefly discussed finite element (FEM) and finite difference (FDM) physical modeling in the Northeast Pacific Program. Those involved in this effort include Zack Powell, Craig Lewis, Al Hermann, Chris Edwards, Hal Batchelder and Dale et al. The circulation models comprise a suite of nested models varying from 40km basin and 10km NEP scales to 2km regional models capable of resolving estuarine processes. Runs of the 10km scale model should begin in a couple of months. Currently there are a series of idealized model runs being conducted to examine upwelling near capes and banks. The velocity fields from these model runs are being used by Batchelder for biological modeling and Edwards for energetics.
Biological modeling in the NEP is occurring on a number of fronts. Zack Powell and Sarah Hinkley are both carrying out NPZ modeling and there are significant differences between these efforts. Sarah's model is striving for initial realism and uses 10 components; Zack's simpler model is composed of just 4 components. An individual based model for copepods and euphausiids, incorporating physics and NPZ dynamics, has been developed by Batchelder et al. These researchers are interested in the influence of environmental conditions on individual growth and behavior and how this may determine demographic processes and retention nearshore. The IBM includes feeding and vertical migration and suggests that vertical migration plays an important role in the success of copepods in the system.
Zack Powell suggested a comparison between biological models in the different programs, especially between Hal's IBM model and Eileen's krill model. Hal's work uses an NPZ model and 'food' is calculated at run time. Velocity is read from a saved field. The physical model used in the Southern Ocean Program is ROMS.
Ted Strub discussed the improvements three new long range radar sites have made over existing short range stations. The three stations are located in Florence, Cape Blanco and Cresent Hill. (How far out were the 80% returns? And what were they before?)
Ships used last year were the New Horizon (for plankton, birds and mammals), the Sea Eagle (for fish trawling) and the Wecoma (for SeaSoar work). This year research taking place onboard any particular ship will be more compatible and ship time will be used more effectively.
Suzanne Strom gave the Coastal Gulf of Alaska update. She talked about the general region, its relation to the Kurishio Current and the importance of buoyancy driven flows in the Alaska Current. She discussed LTOP and the ongoing process studies. She then moved to Tim Wiengartner's overview of the hydrography of the CGOA region. The shelf in the Gulf of Alaska is deep and subject to strong downwelling and topography is important in determining flow. Ted noted that water seems to flow out at the surface along the trough as offshoot of the ACC and water is moving in at depth. Drifters suggest cyclonic flow within the basin and have been tracked as long as 15 days. Suzanne showed a plot of the upwelling index and the discharge for a year, both of which influence buoyancy and stratification in the region. She said that there is variability in the timing of the peaks in these curves from year to year. Eddies sometimes persist in the vicinity of the Seward Line and Suzanne pointed out the importance of the Cape Clear Section in providing upstream information for the Seward Line data. Stratification does not occur uniformly in the Gulf of Alaska and productivity is not locked to solar. Fresh water input is very important and so flow patterns must be taken into consideration. Eddy driven freshwater losses (and eddy associated upwelling areas) may be a source of seasonal/interannual
Higher biomass is usually encountered on the western end of the Seward Line. In April 2000, winds were downwelling and Seawifs imagery indicated significant mesoscale variability in the area including shelf break eddys. Zooplankton biomass was high in ACC. MOCNESS hauls along the Seward Line identified changes in community composition as one moved offshore. The August 2000 survey found pink salmon abundant inshore and rockfish offshore.
An autocorrelation study using hydroacoustic data collected along the Seaward Line was undertaken to look at length scales for zooplankton to fish sized organisms. The study identified zero crossings at about 10km in May 1998 and 20km in May 1999. The Rosby radius is approximately 10km. The length scale of the patches, then, is on the order of the length scale of the Rossby Radius and therefore on the size of the mesoscale features. (Note that biological dynamics (turnover) are on the order of 3-10 days so one may expect to see changes within coherent features during a sampling.)
The shift in community structure may be related to hydrographic zonation. Brunt Vaisala frequencies where calculated for different areas on the shelf. The inner shelf is dominated by salinity (buoyancy, stratification), the mid- and outer shelf were dominated by temperature and salinity. This allows the shelf to be divided into three different regions based on the hydrographic regime characteristics: 1) The inner shelf or ACC (35-50km), 2) the midshelf from (50-100km) and 3) the shelf-break front seaward. Ken Loyle did a MDCA cluster analysis and found that the inner, mid, outer and Prince William Sound areas separate out fairly well for zooplankton and hydrographics.
Suzanne then discussed process cruises held in the spring and mid-summer. Stations were occupied along the Seward Line and in Prince William Sound. A fine scale grid was added around each core station to provide background information. The species composition in the Prince William Sound outflow was different than elsewhere on the inner shelf. Growth rate studies of different sized cells were conducted in April, May and July on Neocalanus sp., Pseudocalanus, Calanus and Eucalanus. Growth was measured on all and fecundity estimated for the last three. Growth rates were lower than expected which indicates nutrient limitation. Shipboard experiments demonstrate nutrient limitation on the inner and mid shelf, but not on the outer shelf nor in Prince William Sound. Nutrients were expected to be limiting on the outer shelf given the degree of stratification present there. Larger cells are stimulated to a greater extent than smaller cells when nutrients are limited and so are likely driving variability in Chl-a. Cell division rates are about 0.7 day or a doubling about every day.
Microzooplankton data from the FlowCam was discussed. Concentrations of about 10 cells/liter can be handled by the system and it provides near real-time images of what is present in the water. Experiments suggested that copepods are removing microzooplankton and releasing diatoms from predation.
In the CGOA there are 6 LTOP surveys per year (March, April, May, July, August and December) for three years ending in 2003. No process work will take place next year (2002) as resources are shifted to the California Coastal Current Program. The next process work in the CGOA is scheduled for 2003. In the CCC the LTOPs were(are) in 2001, 2002 and 2003. Process work will take place in 2002.
Historical and recent observations have identified persistent mesoscale features in both the Coastal Gulf of Alaska and California Coastal Current study areas. The existence of these features should allow the design and implementation of an effective mesoscale survey. Negotiations are underway to see if this important work can be added to the project. However, it appears that the Program may need to identify additional sources of funding to get this component in place. Two cruises at 20 days each should cost approximately 150K. We will also require an additional 2 years to work up the data. The project may therefore cost 500K per field year and 250K for analysis for the next two years. A backup plan should be in place if a funding source cannot be found. Comparability to other programs, especially within the NEP, is critical to the success of the Program as a whole. It is also imperative the mesoscale, LTOP and process cruises are conducted in a coherent manner.
A short, well-defined draft AO for the mesoscale survey should be targetted for release around January 2002. This should probably be written by Hal, Mike, Ted and Suzanne. The NEP website should also be set up as an easy-to-access clearing house for information to facilitate proposal writing by the general community.
Kenric Osgood suggested that it might be very productive to list the current infrastructure capable of providing coverage to the program. What do we know and what can be leveraged? Is information available in the NOAA/NMFS Salmon Surveys, CCC Work, Seawifs image collections, gliders and/or other sources?
A question was raised about the synopticity of SeaSoar. SeaSoar isn't synoptic, but the survey can be run in about five days and features are relatively stable within that time frame. Hermann's models, which are under-resolved in the area right now, display reasonable dynamics and suggest processes are autocorrelated for 6-9 days in the ACC and 3-6 days in the CCC.
Difficulty in ship scheduling or inadequate funding is not necessarily a good reason for not having a mesoscale survey. We should work toward the survey in a positive way. Perhaps aircraft could be used to deploy XBTs to get a handle on the physical environment. If XBTs are a possibility, NCAR has a C130 aircraft which may be available during the next couple years. NOAA also has a P3 which may be relatively inexpensive and can provide ocean color data as well. The Program may also consider investigating Coast Guard overflights. A surface salinity mapper is under also development and may prove useful.